Ajackus partnered with Multiples — a Mumbai-based private equity firm managing high-value investment portfolios for high-net-worth individuals and institutions — to replace a manual, Excel-dependent reporting process with an automated ETL-powered data portal, reducing report generation time from 2–3 weeks to minutes and eliminating the version control and human error risks that had undermined reporting reliability.
Engagement Model
Team Augmentation
Your team, supercharged — every Ajackus engineer comes AI-native, shipping 40–60% faster from day one
Managed Delivery
Tell us the problem. We handle everything — discovery, architecture, build, testing, deployment — at AI speed
BOT Model
We build your offshore engineering center with AI-trained teams, operate it to maturity, then transfer ownership to you
Expertise
AI Development
Custom AI agents, LLM integrations, RAG pipelines, and AI enablement — from strategy to production
Web Development
Enterprise web applications built with AI-augmented engineering for 40-60% faster delivery
Mobile Development
Native and cross-platform mobile apps built at AI pace with rigorous automated quality
DevOps
Infrastructure that scales automatically, deploys safely, and costs less
Low-Code/No-Code
Airtable, Glide, Shopify, and WordPress solutions with AI automation layers — built in days
Data Analytics
Turn raw data into decisions that drive revenue — 80% faster with AI-assisted analytics
UI/UX Design
User-centered interfaces designed with AI-powered speed — 3x faster iteration, sharper insights


How Multiples Cut Investment Reporting Time from 3 Weeks to Minutes with an Automated Data Portal
Services
Data Analytics
Technologies


Weeks to Minutes
Report Generation Time
Zero
Manual Data Consolidation Steps
5+
Report Types Automated
Overview
Executive Summary
Client
Challenge
Goals
Journey
Results
Technology
Takeaways
FAQ
Executive Summary
The Problem
Multiples, a private equity firm serving high-net-worth clients, was generating all investor reports manually in Excel — a process that took 2–3 weeks per report cycle, introduced significant risk of human error, and meant that client data requests could not be fulfilled for up to a week after they were received.
The Solution
Ajackus built a customised ETL-powered data portal that automates report generation end-to-end — ingesting data from source systems, applying Multiples-specific transformation logic, and producing P&L statements, portfolio summaries, investor performance analyses, and distribution reports on demand, with dynamic linking to eliminate version control issues.
The Result
Multiples now generates reports in minutes rather than weeks. Client data requests are fulfilled without manual intervention, version control conflicts have been eliminated through dynamic data linking, and the risk of human error in the reporting process has been effectively removed.
Client
Multiples is an India-based private equity firm with a focus on helping high-net-worth individuals and institutional investors navigate investments in high-growth startups and emerging companies. The firm’s value proposition is built on expertise, precision, and responsiveness — qualities that require accurate, timely financial reporting. Prior to engaging Ajackus, Multiples relied entirely on manual Excel-based processes for all investor reporting, a model that had become a structural bottleneck as the firm’s portfolio and client base grew.
| Industry | Private Equity / Finance |
| Client Base | High-Net-Worth Individuals and Institutional Investors |
| Headquarters | India |
| Engagement Model | Managed Delivery — data portal design, ETL development, and reporting automation |
| Relationship | Initial engagement; Ajackus as primary data analytics partner |
Challenge
The Bottom Line
Multiples needed to eliminate manual, error-prone Excel-based reporting and replace it with an automated data platform that could generate complex investor reports on demand — without compromising accuracy or introducing new operational complexity.
Report Generation Taking 2–3 Weeks
Every investor report at Multiples began with manual data collection from multiple sources, followed by consolidation into Excel, formula application, formatting, and review. From start to finish, a single report cycle took 2–3 weeks — an unacceptable lag for a firm whose clients expect timely, accurate performance data, particularly during active investment periods or market events.
Delayed Response to Client Data Requests
When clients requested specific data — performance summaries, distribution calculations, portfolio snapshots — Multiples could not respond in real time. The manual process meant that even urgent client requests required approximately one week to fulfil. In private equity, where client confidence is directly tied to perceived operational sophistication, this delay posed a reputational risk alongside an operational one.
Heightened Risk of Human Error
With every report passing through multiple manual steps — data entry, formula construction, cross-referencing, and review — the risk of error was structural. A single incorrect cell in an Excel model could cascade into inaccurate portfolio summaries or miscalculated returns. For a firm managing high-value investments, any error in investor reporting carries both financial and reputational consequences.
Goals
The project focused on replacing a manual Excel reporting process with an automated, error-free data portal.
| Goal | Outcome Required |
|---|---|
| Automate report generation | End-to-end automation from data ingestion to formatted report output |
| Eliminate manual consolidation | No human data entry in the reporting pipeline |
| Customise ETL for Multiples’ data structure | Transformation logic aligned with Multiples’ portfolio taxonomy and reporting categories |
| Support all report types | P&L, portfolio samples, portfolio summaries, investor performance, distribution reports |
| Eliminate version control issues | Dynamic linking to ensure all stakeholders always see current data |
| Reduce human error risk | System-generated calculations replacing manual formula construction |
Journey
Ajackus built Multiples’ automated reporting portal across four structured phases, from data audit to dynamic linking implementation.
Phase 1: Data Audit and Requirements Mapping
The Ajackus team began by conducting a thorough audit of Multiples’ existing Excel-based reporting process — documenting every data source, transformation step, report category, and output format in use. This audit mapped not just what was being produced, but why each report was structured the way it was, ensuring that the automated system would produce output that matched the analytical judgements embedded in the existing process.
Phase 2: ETL Pipeline Design and Build
Using Extract, Transform, Load (ETL) methodology, the Ajackus team designed a customised data pipeline that ingests raw data from Multiples’ source systems, applies the firm’s specific transformation logic (including filtering, categorisation, and calculation rules), and produces clean, structured data ready for reporting. Intermediate data formats were created with appropriate filters to ensure that the right data reached the right report type — without cross-contamination or duplication. The ETL pipeline was built to Multiples’ specific portfolio taxonomy and investor reporting requirements, not to a generic finance template.
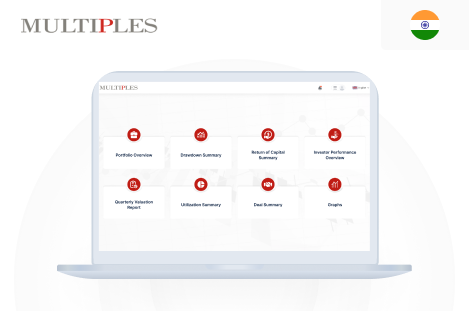
Phase 3: Data Portal and Reporting Layer Build
On top of the ETL pipeline, the Ajackus team built a data portal interface that enables Multiples’ team to generate any supported report type on demand — without any technical knowledge or developer involvement. The portal supports: Profit and Loss statements, portfolio sample reports, portfolio summary views, investor performance analyses, and distribution reports. Power BI was used for the reporting and visualisation layer, providing Multiples’ team with interactive dashboards and export-ready report formats aligned with their client communication standards.
Phase 4: Dynamic Linking and Version Control Resolution
A persistent challenge with Excel-based reporting is version proliferation — multiple copies of the same report at different points in time, with no clear indication of which is current. The Ajackus team implemented dynamic linking across the data portal, ensuring that all reports always reflect the most current underlying data. When source data is updated, every connected report updates automatically — eliminating version conflicts and the need for manual reconciliation.
Results
Multiples transformed from a manual Excel-dependent reporting process to an automated, on-demand data portal that generates reports in minutes.
Minutes
Report Generation Time (Down from 2–3 Weeks)
5
Report Types Fully Automated
Zero
Manual Data Entry Required
What went well:
Operational Achievements
- Report generation time reduced from 2–3 weeks to minutes — across all supported report types
- Client data requests now fulfilled on demand, without manual data preparation
- Version control issues eliminated through dynamic data linking across the full reporting suite
- No human data entry required in the automated reporting pipeline
Technical Achievements
- Fully customised ETL pipeline built to Multiples’ specific portfolio taxonomy and reporting logic
- Five distinct report types automated: P&L statements, portfolio samples, portfolio summaries, investor performance analyses, and distribution reports
- Power BI reporting layer integrated for interactive dashboards and export-ready output
- Dynamic linking implemented to ensure all reports reflect live data at all times
Business Impact
- Multiples’ reporting capability now scales with portfolio growth without requiring additional analyst headcount for report production
- The firm can respond to client data requests within minutes — a capability that directly supports client retention and competitive positioning in private equity
- Human error risk in the reporting process has been structurally eliminated through automated calculation and transformation logic
- Multiples’ team can focus analytical attention on investment decisions rather than data preparation
Why It Worked
Transformation Logic Before Technology
The Ajackus team invested heavily in understanding Multiples’ existing Excel logic before writing any code — mapping every transformation rule, filter condition, and calculation method that had been embedded in manual processes over time. This meant the automated system preserved the analytical sophistication of the existing approach whilst removing the manual labour.
Report-Type Specificity
Rather than building a generic financial reporting tool, the Ajackus team built five distinct report types matched precisely to Multiples’ investor communication needs. Each report reflects the specific data, structure, and narrative that Multiples’ clients expect — not a lowest-common-denominator template.
Eliminating Operational Debt
Excel-based reporting generates operational debt: version proliferation, formula fragility, and consolidation overhead that compounds with every new report cycle. The Ajackus team eliminated this debt structurally through dynamic linking and automated pipeline architecture — freeing Multiples from a recurring operational burden.
Frequently Asked Questions
How does the Multiples data portal reduce report generation from weeks to minutes?
The portal replaces every manual step in the previous reporting process with automation. Source data flows through a customised ETL pipeline that handles extraction, transformation, and loading automatically — applying Multiples' specific portfolio logic and calculation rules without human intervention. Once the pipeline runs, any of the five supported report types can be generated by the Multiples team on demand, in minutes, directly from the portal interface.
What types of reports does the Ajackus-built data portal support for Multiples?
The portal currently supports five report types: Profit and Loss statements, portfolio sample reports, portfolio summaries, investor performance analyses, and distribution reports. Each was designed to match Multiples' existing investor reporting standards and client communication requirements — not a generic financial template.
How does dynamic linking prevent the version control problems that plagued the Excel-based process?
Dynamic linking ensures that all reports are generated from live, connected data rather than static snapshots. When underlying data is updated — for example, when new portfolio valuations are received — every connected report automatically reflects the updated figures. There is no need to regenerate, redistribute, or reconcile multiple report versions. The Multiples team always works from a single source of truth.
Can Ajackus build data automation tools for private equity firms that manage complex, non-standard data structures?
Yes. The Multiples engagement was built entirely around Multiples' specific portfolio taxonomy, reporting categories, and investor communication requirements — not a pre-built template. The ETL pipeline applies custom transformation logic that reflects the firm's analytical methodology. Ajackus has built data solutions across fintech, private equity, and enterprise finance, and routinely handles non-standard data structures that off-the-shelf tools cannot accommodate.
How quickly can Ajackus audit an existing manual reporting process and begin building an automated replacement?
For an engagement of Multiples' scope — five report types, custom ETL, and Power BI integration — the Ajackus team typically completes the data audit and requirements mapping phase within the first 2–3 weeks, with pipeline development and portal build following in subsequent sprints. The exact timeline depends on data source complexity and the number of transformation rules in the existing process. Contact hello@ajackus.com to discuss a scoping session.


Let’s Build your Project Together