Ajackus partnered with Kroll — a global leader in risk assessment, governance, and advisory services — to build a Power BI analytics portal that automated ETL processes across non-uniform third-party travel data sources, delivering real-time dashboards and anomaly detection that broke booking records and surpassed revenue targets.

Engagement Model
Team Augmentation
Your team, supercharged — every Ajackus engineer comes AI-native, shipping 40–60% faster from day one
Managed Delivery
Tell us the problem. We handle everything — discovery, architecture, build, testing, deployment — at AI speed
BOT Model
We build your offshore engineering center with AI-trained teams, operate it to maturity, then transfer ownership to you
Expertise
AI Development
Custom AI agents, LLM integrations, RAG pipelines, and AI enablement — from strategy to production
Web Development
Enterprise web applications built with AI-augmented engineering for 40-60% faster delivery
Mobile Development
Native and cross-platform mobile apps built at AI pace with rigorous automated quality
DevOps
Infrastructure that scales automatically, deploys safely, and costs less
Low-Code/No-Code
Airtable, Glide, Shopify, and WordPress solutions with AI automation layers — built in days
Data Analytics
Turn raw data into decisions that drive revenue — 80% faster with AI-assisted analytics
UI/UX Design
User-centered interfaces designed with AI-powered speed — 3x faster iteration, sharper insights


How Kroll Built a Real-Time Business Intelligence Portal That Broke Booking Records and Exceeded Revenue Targets with Power BI
Services
Data Analytics and Business Intelligence
ETL Automation
Dashboard Development
Technologies

Record
Bookings — New Performance High
Exceeded
Revenue Financial Targets
Real-Time
Anomaly Detection and Resolution
Overview
Executive Summary
Client
Challenge
Goals
Journey
Results
Technology
Takeaways
FAQ
Executive Summary
The Problem
Kroll’s travel data operations were undermined by non-uniform Excel datasets arriving from third-party partners, a lack of centralised data consolidation, and persistent VPN timeout issues that interrupted critical data streams — leaving decision-makers without reliable, real-time visibility into booking performance, revenue, and operational anomalies.
The Solution
Ajackus designed and built a secure Power BI analytics portal with automated ETL pipelines, Power Query-based data standardisation and enrichment, and interactive dashboards with role-based access control — consolidating Kroll’s disparate travel partner data into a single, queryable intelligence layer.
The Result
Kroll broke booking records and surpassed revenue targets. The platform delivered real-time anomaly detection enabling swift financial transaction resolution, and identified loss-making operators for route and schedule optimisation — directly informing strategic business decisions. Specific figures remain confidential per client agreement.
Client
Kroll is a global expert services and advisory firm providing risk assessment, governance, transactions, and valuation services across industries. In this engagement, Kroll required a business intelligence solution capable of consolidating travel partner performance data from multiple sources into a unified analytics platform — supporting the operational and financial oversight needed to manage a complex, multi-partner travel services business. The engagement required Ajackus to address both the technical challenge of data standardisation at scale and the operational challenge of maintaining uninterrupted data pipeline connectivity.
| Industry | FinTech / Risk Advisory and Business Intelligence |
| Data Sources | Third-party travel partner Excel datasets (non-uniform schemas) |
| Output | Secure Power BI portal with interactive dashboards and role-based access |
| Engagement Type | Data Analytics and Business Intelligence (Managed Delivery) |
Challenge
The Bottom Line
Kroll needed a centralised business intelligence platform that could ingest non-uniform travel partner data, standardise and enrich it automatically, detect anomalies in real time, and deliver interactive reporting to decision-makers through a secure, access-controlled portal — without manual data reconciliation at any stage.
Kroll’s travel data environment was characterised by fragmentation: multiple third-party partners submitting data in inconsistent Excel formats, each with different schemas, naming conventions, and levels of completeness. Before any analytics work could begin, significant data preparation was required — and that preparation was happening manually, creating a recurring bottleneck between data receipt and business insight.
Compounding this was a connectivity problem: the VPN connections used to access critical data streams were subject to frequent timeouts, requiring manual reconnection and creating gaps in what should have been continuous data pipelines. These interruptions affected the timeliness of the analytics output and, by extension, the speed at which Kroll could identify and respond to operational anomalies.
Non-Uniform Third-Party Data Schemas
Travel partner data arrived in Excel files with no standardised schema — different column names, date formats, currency representations, and data completeness across partners. Consolidating this data into a single analytical model required both a technical ETL solution and a data governance strategy capable of handling the variability that would continue with each new data submission.
Data Consolidation Complexity at Volume
The volume of incoming travel partner data meant that manual consolidation was not a viable long-term approach. Each data submission required evaluation for inconsistencies, cleansing to resolve formatting issues, enrichment with contextual information, and integration into the central repository — a multi-step process that accumulated significant time cost across a high-frequency data environment.
VPN Connectivity Disrupting Data Streams
Frequent VPN timeout events on critical data connections were causing interruptions to the data pipelines that fed the analytics system. Without automated reconnection handling, each timeout required manual intervention to restore connectivity — creating gaps in data continuity and reducing the reliability of real-time reporting at precisely the moments when uninterrupted visibility was most commercially valuable.
Absence of Real-Time Anomaly Visibility
Without a centralised, automated analytics layer, anomalies in booking data, revenue figures, and operator performance were identified reactively — often after they had already affected financial transactions or operational decisions. Kroll required a system capable of detecting and surfacing these anomalies in real time, enabling swift resolution before downstream consequences accumulated.
Goals
The platform needed to transform fragmented, non-uniform travel partner data into a single, reliable intelligence layer — with automated ETL, real-time anomaly detection, and secure interactive reporting as core deliverables.
| Goal | Success Criterion |
|---|---|
| Standardise third-party data inputs | All incoming Excel datasets normalised to a consistent schema without manual intervention |
| Automate ETL pipeline | Extract, transform, and load processes run automatically on new data receipt |
| Build centralised data repository | All travel partner data consolidated into a single, queryable intelligence layer |
| Deploy secure Power BI portal | Interactive dashboards accessible through role-based authentication and authorisation controls |
| Enable real-time anomaly detection | Booking, revenue, and operator anomalies surfaced immediately for swift resolution |
| Identify loss-making operators | Analytics output enables route and schedule optimisation decisions based on operator performance data |
| Resolve VPN connectivity interruptions | Data stream continuity maintained without manual reconnection intervention |
Journey
The Ajackus team approached the Kroll engagement in three interconnected workstreams: data standardisation and governance, ETL pipeline automation, and Power BI portal development. Rather than building dashboards on top of the existing fragmented data environment, the Ajackus team first established the data foundation — clean, enriched, consistently structured data — before building any reporting layer on top of it.
Data Evaluation, Cleansing, and Standardisation
The Ajackus team began by conducting a systematic evaluation of all existing third-party data sources, documenting the schema inconsistencies, formatting variations, and data quality issues present across each partner’s submissions. Using Power Query, the Ajackus team implemented a data preparation and transformation layer that normalised incoming datasets to a consistent schema — standardising date formats, currency representations, field naming conventions, and handling missing or malformed values through defined cleansing rules. Each dataset was also enriched with contextual metadata to enable more granular downstream analysis.
Automated ETL Pipeline and Data Governance
The Ajackus team implemented an automated ETL process that replaced the manual data consolidation workflow. The pipeline extracts data from third-party partner sources, applies the Power Query transformation logic, and loads the cleaned, enriched output into the centralised data model — without requiring manual steps at any stage of the process. Alongside the automation, the Ajackus team developed a data governance strategy defining how incoming data should be evaluated, documented, and maintained over time, ensuring the platform remains reliable as partner data volumes and formats evolve.
Power BI Portal with Secure Access and Interactive Dashboards
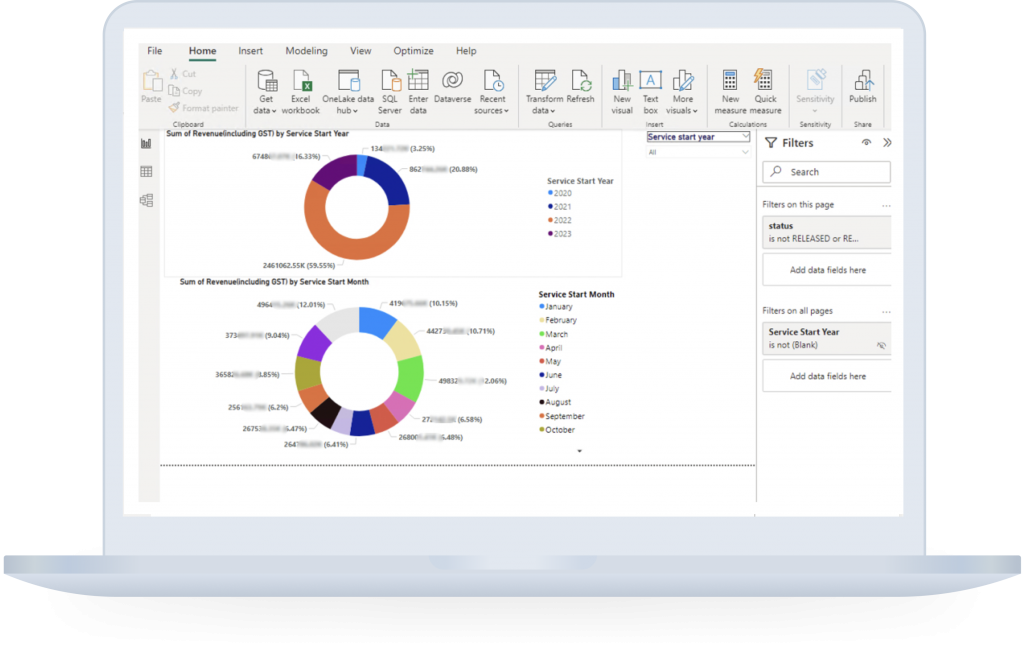
The Ajackus team built a dedicated Power BI portal with authentication and authorisation controls that restrict access based on user role — ensuring that each Kroll stakeholder sees the data relevant to their function without exposing sensitive commercial information across the organisation. The portal’s interactive dashboards were designed for dynamic data exploration: users can filter by operator, route, time period, and booking category to drill into the metrics most relevant to their decisions. The dashboard architecture was tailored to support diverse data model requirements across the different travel partner sources, rather than applying a single generic view to all data types.
VPN Connectivity Management and Anomaly Detection
The Ajackus team implemented connection management logic to address the VPN timeout issues that had been disrupting data stream continuity. Alongside connectivity reliability improvements, the platform was configured to surface anomalies in booking data, financial transactions, and operator performance in real time — enabling Kroll’s operations team to identify and resolve issues before they propagated through downstream systems. The anomaly detection capability specifically enabled identification of loss-making operators whose route and schedule configurations were generating negative returns, providing the analytics foundation for targeted operational optimisation.
Results
The Kroll Power BI portal delivered measurable commercial outcomes — breaking booking records and exceeding revenue targets — whilst giving the operations team real-time visibility into anomalies and operator performance. Specific figures are held confidential per client agreement.
Record
Booking Performance Achieved
Exceeded
Revenue Financial Targets
Real-Time
Anomaly Detection Operational
What went well:
Operational Improvements
- Manual data consolidation eliminated — the automated ETL pipeline processes all incoming travel partner data without human intervention at any stage
- Real-time anomaly detection enabled swift resolution of financial transaction irregularities before they affected downstream reporting or commercial relationships
- Loss-making operators identified through the analytics layer, providing the data foundation for route and schedule optimisation decisions
- VPN connection reliability improved, ensuring continuous data stream availability without manual reconnection overhead
Technical Achievements
- Power Query transformation layer normalises non-uniform third-party Excel datasets to a consistent schema, handling formatting variations and data quality issues automatically
- Centralised data model consolidates all travel partner sources into a single, queryable repository with enriched contextual metadata
- Secure Power BI portal with role-based authentication and authorisation controls appropriate to a risk advisory environment
- Interactive dashboard architecture supports dynamic filtering by operator, route, time period, and booking category across diverse data model types
Business Impact
- Booking volumes broke previous records — a direct commercial outcome enabled by the operational visibility the platform provides
- Revenue exceeded financial targets, with the platform’s anomaly detection and operator performance analytics contributing to optimised commercial decisions
- Security concerns identified and resolved through the platform’s access controls and data governance framework
Why It Worked
Data Quality Before Analytics
The Ajackus team did not attempt to build dashboards on top of raw, inconsistent partner data. The first investment was in the Power Query transformation layer — standardising, cleansing, and enriching the data before it reached any reporting surface. This sequencing is what made the analytics reliable: dashboards built on clean data surface accurate insights; dashboards built on dirty data surface misleading ones.
Governance Built Alongside Automation
The Ajackus team delivered a data governance strategy alongside the ETL automation — not as a follow-up deliverable. This meant Kroll had documented rules for how incoming data should be evaluated and maintained from the moment the platform went live, rather than discovering data quality problems as new partner datasets arrived. The governance framework is what makes the automation sustainable as data sources and schemas evolve.
Dashboards Designed for Decisions, Not Data
The Power BI dashboards were architected around the specific decisions Kroll’s stakeholders needed to make — operator performance review, booking trend analysis, anomaly investigation — rather than simply displaying available data fields. Role-based access ensured each stakeholder saw the data most relevant to their function. The result is a portal that drives action, not one that requires interpretation before it becomes useful.
Frequently Asked Questions
How did the Power BI portal handle non-uniform data from multiple travel partners?
The Ajackus team built a Power Query transformation layer that sits between the raw partner data and the Power BI data model. Each incoming Excel dataset — regardless of the partner’s schema, naming conventions, or formatting practices — passes through this transformation layer, which normalises it to a consistent structure before it enters the centralised repository. The layer applies cleansing rules to handle missing values, formatting inconsistencies, and data quality variations, then enriches the normalised data with contextual metadata to support downstream analysis. New partner data submissions are processed automatically through the same pipeline without requiring schema-specific manual preparation.
How does the platform detect anomalies in booking and financial data?
The Power BI portal is configured to surface deviations from expected patterns in booking volumes, financial transaction data, and operator performance metrics in real time. When an anomaly is detected — an unusual booking spike, a revenue discrepancy, or an operator performance outlier — it is flagged immediately within the dashboard interface, enabling Kroll’s operations team to investigate and resolve the issue before it affects downstream reporting or commercial relationships. The real-time detection capability replaced a reactive model where anomalies were discovered only during periodic manual reviews.
How were loss-making operators identified through the analytics platform?
The centralised data model consolidates booking, revenue, and cost data across all travel partner operators in a common structure. The Power BI dashboards allow Kroll’s team to filter and analyse performance by operator, route, and schedule — making it straightforward to identify which operators or routes are generating negative returns relative to their cost base. This operator-level profitability view was not available before the portal was built, as the underlying data existed in separate, incompatible partner datasets that could not be compared without significant manual effort.
How quickly can Ajackus build a business intelligence portal for complex, multi-source data environments?
The Kroll engagement demonstrates Ajackus’s ability to deliver a complete business intelligence solution — ETL automation, data standardisation, Power BI portal with role-based access, and real-time anomaly detection — for a client with non-uniform data inputs and operational connectivity challenges. Ajackus operates across three engagement models: Team Augmentation, Managed Delivery, and Build-Operate-Transfer. For BI and analytics engagements, Ajackus typically onboards a scoping team within two weeks of engagement confirmation, with portal delivery timelines determined by data source complexity and reporting requirements.
How does Ajackus handle data governance for business intelligence projects?
Ajackus treats data governance as a core deliverable in analytics engagements, not an afterthought. For the Kroll project, the Ajackus team developed a data governance strategy that documented how incoming partner data should be evaluated, cleansed, and maintained — delivered alongside the ETL automation rather than as a separate follow-up. This approach ensures that the analytics platform remains reliable as data sources change, new partners are onboarded, and schema variations emerge. Ajackus’s data engineering practice has experience building governance frameworks for multi-source, heterogeneous data environments across fintech, logistics, and enterprise advisory sectors.
Can Ajackus implement secure, role-based access controls in Power BI environments?
Yes. The Kroll Power BI portal was built with authentication and authorisation mechanisms that control access based on user role — ensuring each stakeholder sees the data relevant to their function without exposing sensitive commercial information across the organisation. This is a standard requirement for analytics portals in risk advisory and financial services contexts, and the Ajackus team designed the access architecture specifically to meet Kroll’s operational security requirements. Ajackus has experience implementing secure analytics environments across regulated and commercially sensitive industries.





Let’s Build your Project Together